Project Overview
This project provides a variety of visualizations of selected profiles of immgration to the US.
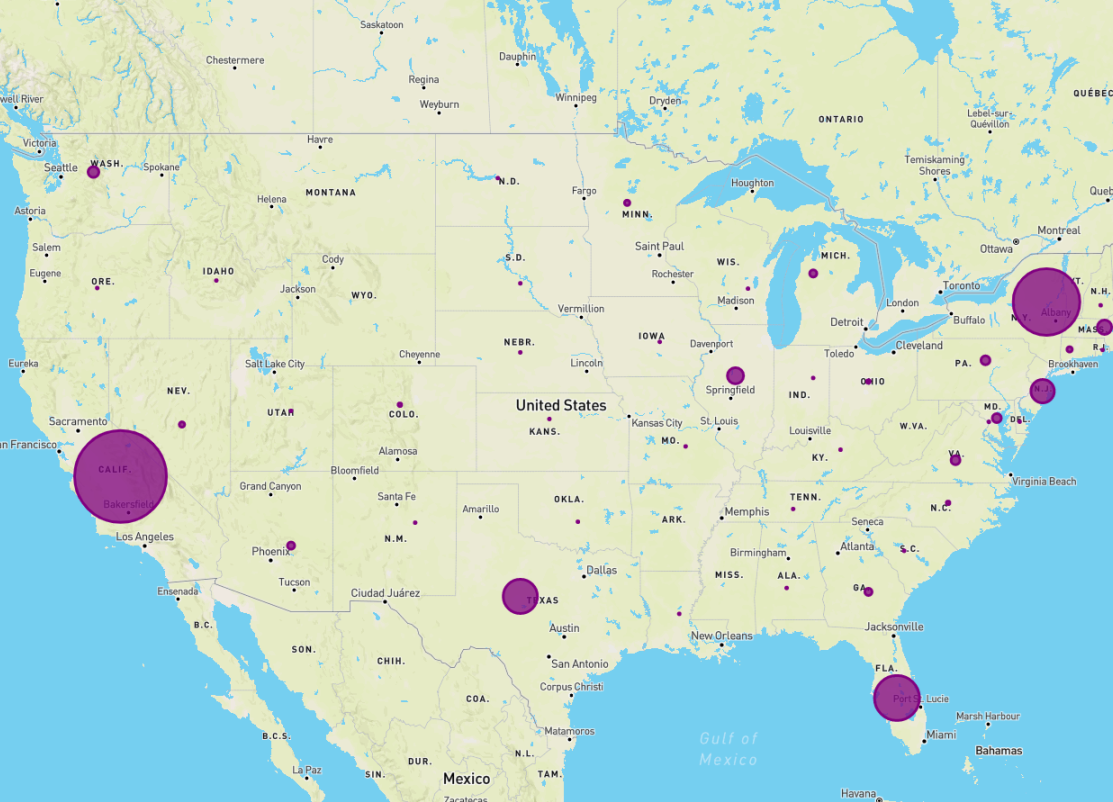
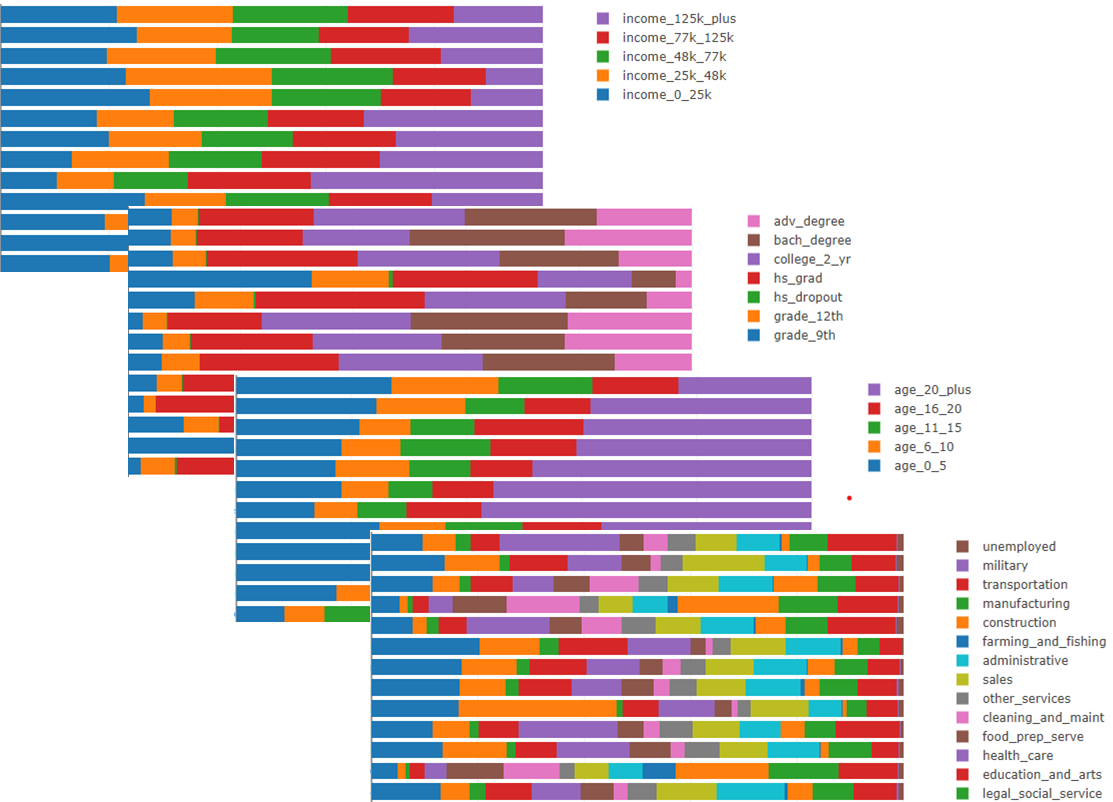
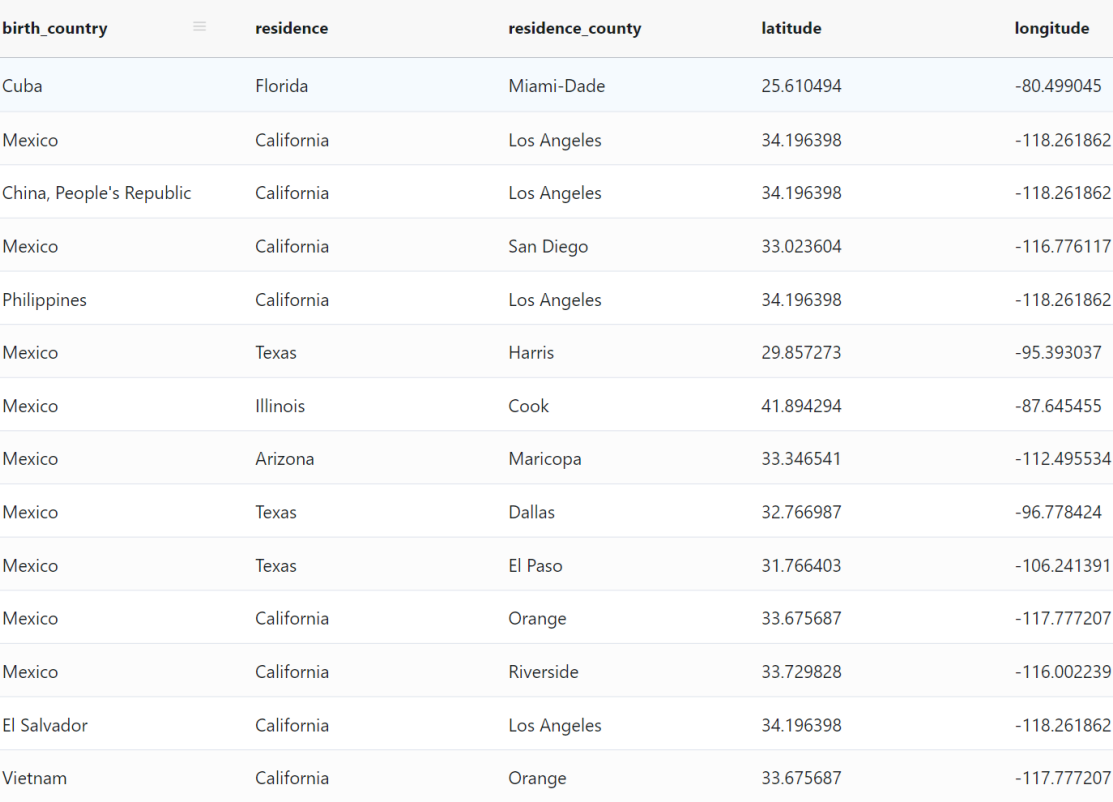
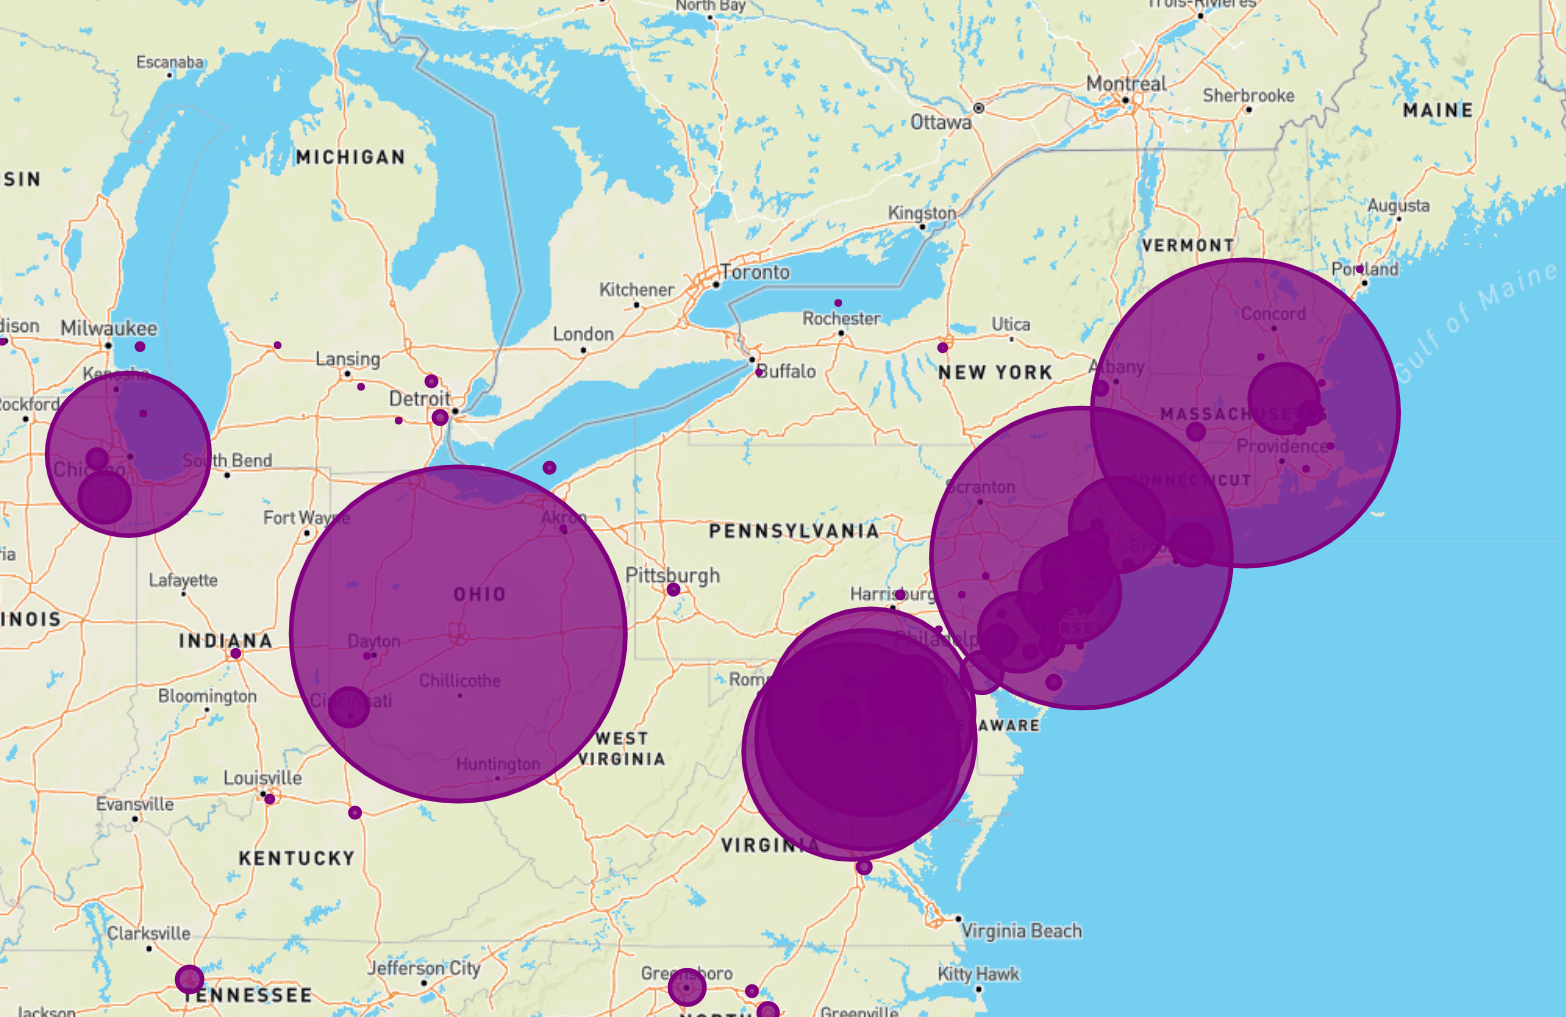
This site provides visualizations of selected demographic profiles in the US, including a heat map of where immigrants settle, their educational attainment and their main occupations
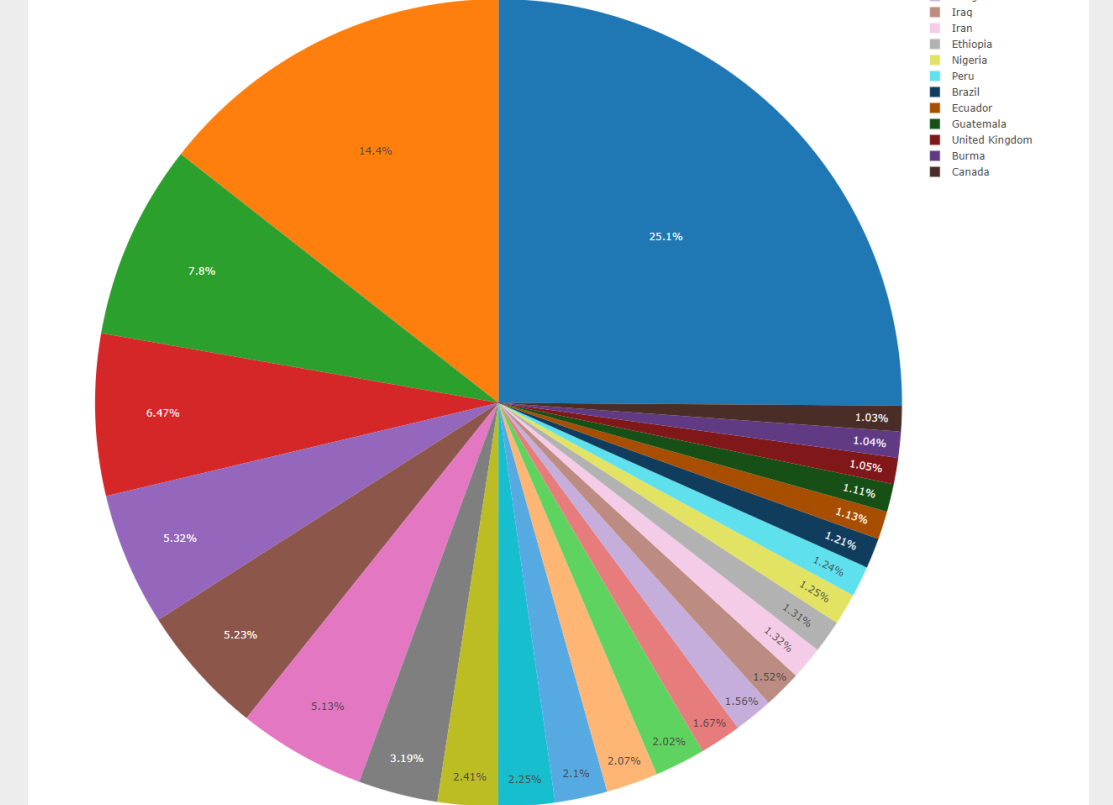
You can find a snapshot of some of the visuals of demographics on this page. The charts below show the age structure of and diversity in nationality of immigrants in 2018. Select from the plot button in the upper right hand corner for interactive charts,
Visualizations